Animation showing spatially ambiguous interaural time differences (ITD) when wavelength is long relative to head circumference (wavelength > ~1/8 head circumference).
● Upper vertical lines show ITDs that vary in an orderly manner with azimuth.
● Lower vertical lines show spatially ambiguous ITDs.
As illustrated above, spatial ambiguities can be evaluated, cycle-by-cycle, in the time domain. To use this method, however, signals must first be filtered - preferably by a bank of cochlea-emulating auditory filters.
Alternatively, spatial ambiguities can be evaluated in the frequency domain using the Fourier transformation.
Below, for instance, is an evaluation of HRTFs obtained using the Neumann KU100 dummy head.
Time domain
HRTF impulses for 45° azimuth
Frequency domain
Phase
Frequency domain
Magnitude
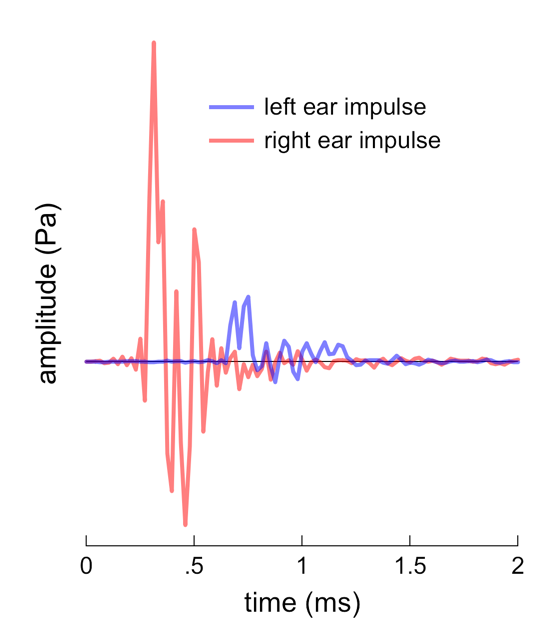

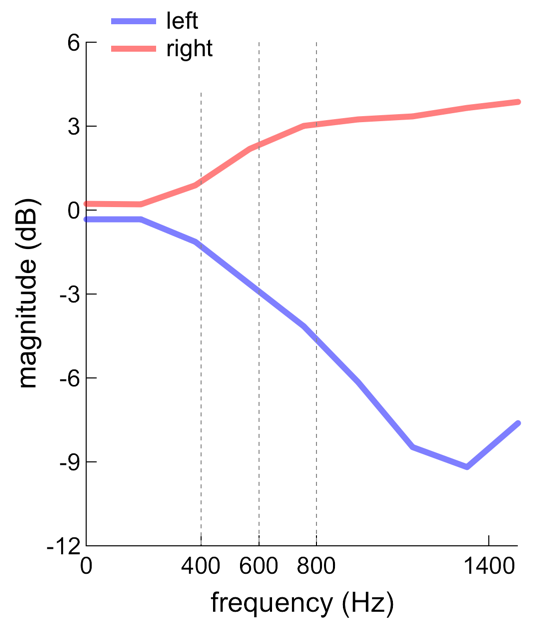
For impulses reflecting 45° azimuth, phase measures indicate that ITD becomes ambiguous above ~600 Hz.
Phase and time ambiguities, illustrated by plotting phase measures (left axes) at 400, 600, or 800 Hz (left to right panels) for a range of frontal azimuths. Right axes show phase measures converted to time (i.e., time = phase/frequency/2π).

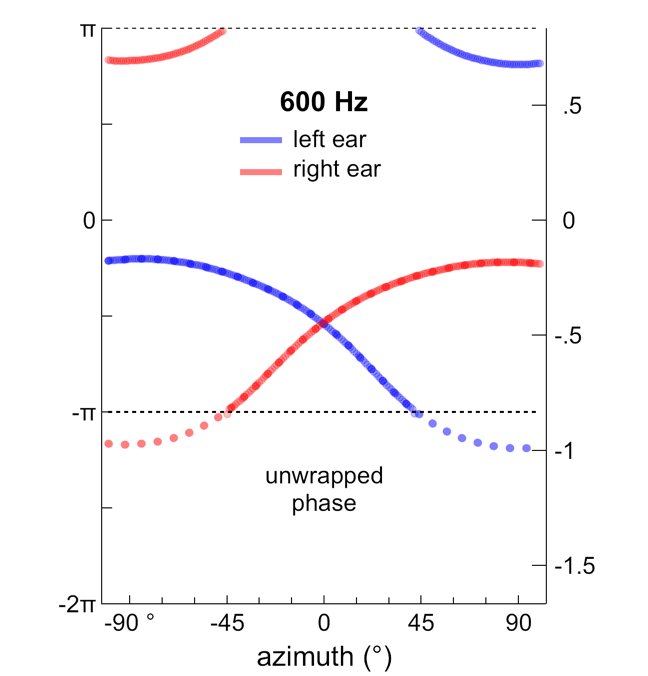

Interaural phase differences (IPD) can be obtained by subtracting left axis values (IPD = right - left ear phase).
Interaural time differences (ITD) can be obtained by subtracting right axis values (ITD = right - left ear time).
Dotted lines showing ‘unwrapped’ phase values are indicative of spatial ambiguities. For an azimuth of 45° and frequency of 800 Hz, for instance, ITD is either 0.56 ms (solid line) or -0.69 ms (dotted line). In contrast, a single ITD value of 0.68 ms is indicated for an azimuth of 45° at 400 Hz.
Frequency domain magnitudes, at 400, 600, and 800 Hz, corresponding to the left and right ears and a range of frontal azimuths.
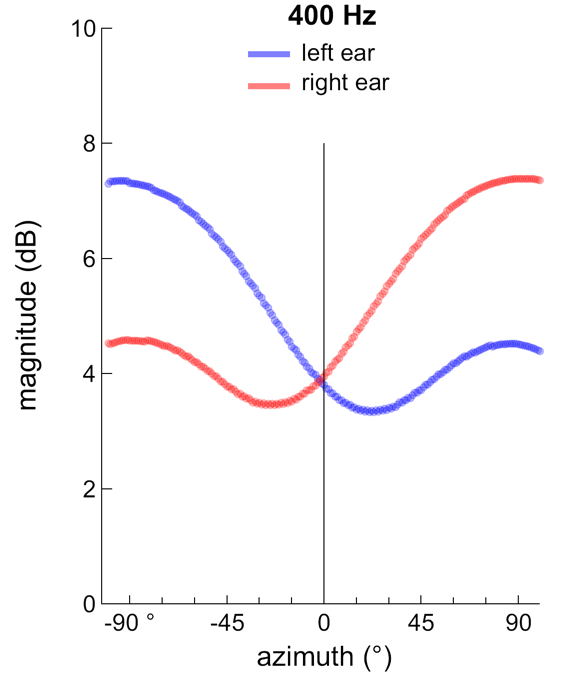
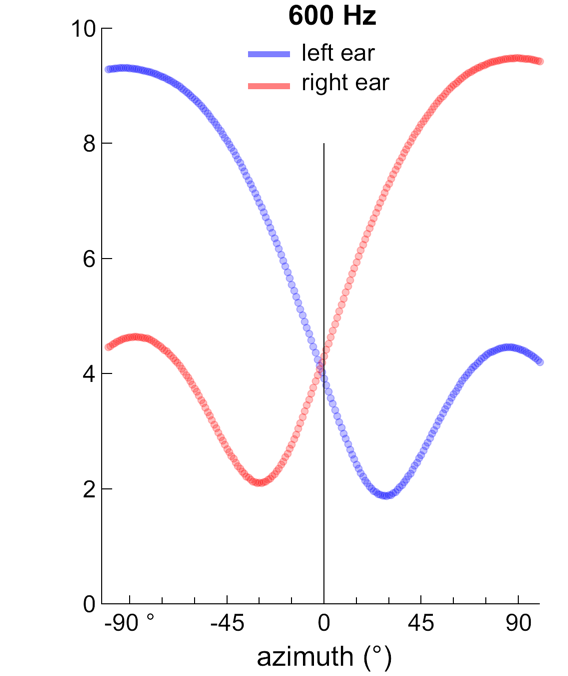
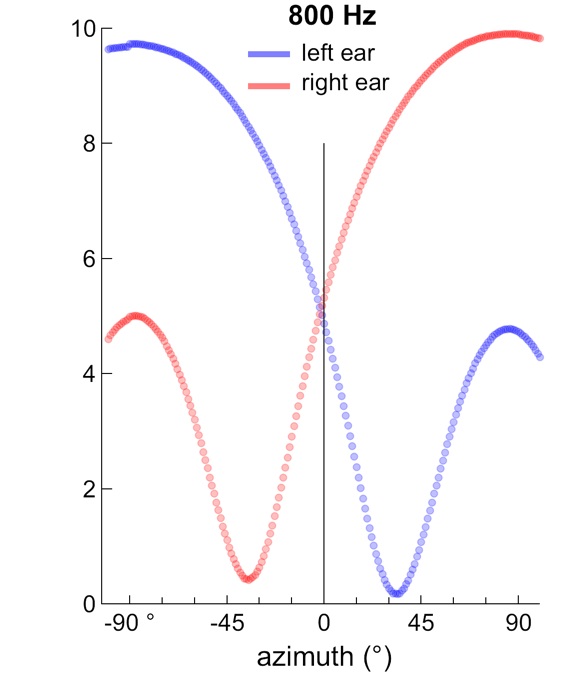
Interaural level differences (ILD) can be obtained by subtraction (ILD = right - left ear magnitude).