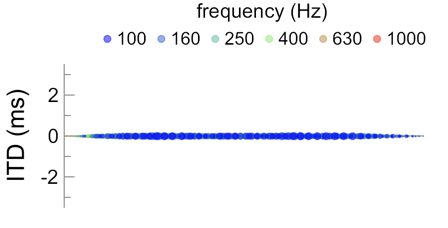
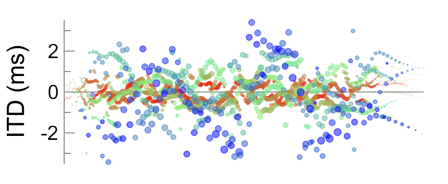
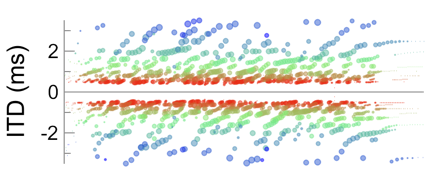
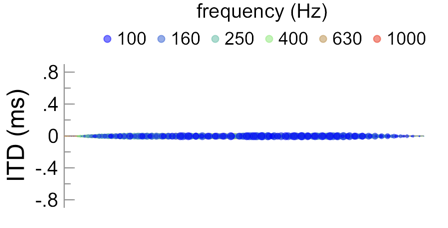
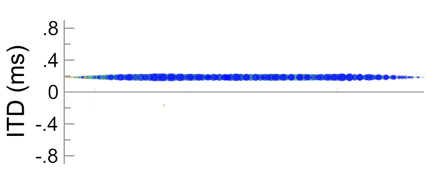
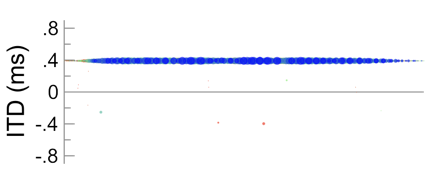
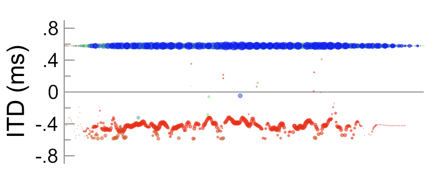
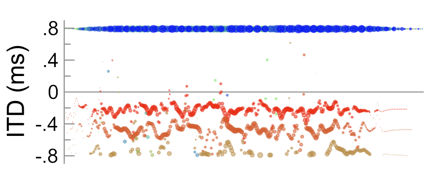
The edge model of spatial hearing proposes that individual neurons are ‘labeled’ by the spatial cues that evoke half-maximal activities long their medial edges. Half-maximal activities evoked across many such neurons, each having a slightly different label, consequently amount to a representation in which half-maximal activities in the left hemisphere represent the righthand ‘edges’ of auditory objects and half-maximal activities in the right hemisphere represent their lefthand edges.
One way to visualized the model is as a topographic map where relief from the lefthand perspective is encoded in the right hemisphere and relief from the righthand perspective is encoded in the left hemisphere.
As with other acoustic and neural models, the edge model performs reasonable well when representing interaural time differences (ITD) under ideal listening conditions. In the examples below, for instance, five single or recurrent interaural phase differences (IPD) are considered: -0.2, -0.1, 0.0, 0.1, or 0.2 cycles, where IPD is estimated as ITD divided by frequency.
The greatest contributions to spatial hearing, under the edge model, arise from activities closest to half of the maximum activity level achieved at any one moment, i.e., the same normalized level used to label individual neurons. A more intuitive graphical scheme, demonstrated below, is thus to transform values exceeding half-maxima by reflecting them downward so that minimal and maximal activities are both viewed as contributing equally little to spatial hearing. Under this graphic scheme, ‘peaks’ are used to indicate where contributions to spatial hearing from half-maximal activities are highest. Such peaks may also be viewed as ‘relief points’ along a topographic contour marking where contributions to spatial hearing are highest.
As previously described for the inter-hemispheric channel model, one possible solution for sub-maximal spatial ambiguities is if representations are suppressed when activities in the left or right hemisphere are low enough.
The edge model, however, provides several more effective possibilities. Sub-maximal spatial ambiguities may be suppressed, for instance, when the edge in one hemisphere is ipsilateral to the edge encoded in the opposite hemisphere. In other words, if the edge encoded in the left hemisphere is to the left of the edge encoded in the right hemisphere, and vice versa, when the edge encoded in the right hemisphere is to the right of the edge encoded in the left hemisphere. Given the population of modeled neurons considered here, contralaterally encoded edges become ipsilateral as IPD approaches and exceeds approximately ±0.2 cycles. Note that ipsilaterally encoded directions also arise when signal polarity is inverted (see below).
Ipsilateral edges could be identified by the auditory system at a number of levels and in a number of ways, including when activities across spatial selective neurons decline with greater peripherality or when activities in excess of half-maxima are evoked.
Where the edge model outperforms alternative models of spatial hearing is under typical listening conditions, when spatial cues generally fluctuate over time, or when considering binaural signals exemplary of typical listening conditions. In the example below, for instance, a hypothetical distribution of five IPDs is considered (0.0, -0.1, 0.1, -0.2, and 0.2 cycles), resulting in two distinct contralaterally encoded half-maximal edges or ‘topographic relief points’: one in the left hemisphere at about ~0.07 cycles and a second in the right hemisphere at about -0.07 cycles. Modeled results are thus consistent with studies showing that auditory images often split into two distinct images or two distinct ‘edges’ when distributions of spatial cues are broad enough.
The edge model is also consistent with inversions of signal polarity that often occur between the left and right ears under typical listening conditions or when listening to signals exemplary of typical conditions. Similar to the example above, phase inversions again result in two distinct half-maximal edges or ‘topographic relief points,’ except that the two edges are ipsilaterally encoded as opposed to contralaterally encoded. In the example below, for instance, IPDs of -0.5 and 0.5 cycles are considered, as would occur if IPD was 0.0 cycles but polarity was inverted in either the right or left ear. The first edge is encoded in the right hemisphere at about 0.025 cycles. The second is encoded in the left hemisphere at about -0.025 cycles.
Edges arising due to polarity inversions can be interpreted in at least two ways. One interpretation is that moderately displaced edges may explain the moderately broad auditory images that listeners perceive when signal polarity is inverted. Another interpretation, however, is that spatial representations are suppressed when the edge in one hemisphere is ipsilateral to the edge encoded in the opposite hemisphere. In other words, if the edge encoded in the left hemisphere is to the left of the edge encoded in the right hemisphere, or if the edge encoded in the right hemisphere is to the right of the edge encoded in the left hemisphere. When this occurs, other spatial cues may become increasing important, such as interaural level differences or interaural time differences across waveform envelopes. Note that this second interpretation is comparable to how spatial ambiguities may be suppressed when IPD magnitude exceeds ~0.2 cycles (given the population of modeled neurons considered here).
Pros:
- • Uniquely consistent with spatial hearing when spatial cues fluctuate or when signal polarity is inverted.
- • Consistent with neurons maximally selective for ITDs corresponding to contralateral directions.
- • Consistent with neurons having steep slopes near the midline.
- • Intuitive in the sense that physical objects may be delineated by their ‘edges’ or ‘contours’, even when they are described a having a single spatial location.
Cons:
- • Without also considering interaural level differences (ILD), edges may become spatially ambiguous for peripheral directions as frequency increases, suggesting that edges of activities ipsilateral to those encoded in the opposite hemisphere may need to be suppressed (unless ILDs and envelope ITDs are also considered).
- • The half-maximal activity level is chosen partly for convenience, equal to half the difference between a normalized activity minimum of 0.0 and maximum of 1.0. Another reason is that modeled neurons are steepest along their medial edges at this activity level. In practice, the true level may momentarily shift as one of many adaptive processes.
