Integration of interaural time & level differences across carrier waveforms
One indication of how interaural time and level differences may be integrated into a single representation within the auditory system is the perceptual ‘trading’ of interaural time and level differences. Generally speaking, an ITD-prompted leftward or rightward judgment of direction may be countered by a proportional change of ILD that would otherwise prompt a countervailing rightward or leftward judgment of direction.
The phenomenon of ‘trading’ suggests that neural activities evoked by ITD and ILD contribute to the same frequency-specific activity patterns within each hemisphere; an interpretation consistent with all three models of spatial hearing considered here, including the inter-hemispheric channel, maximal, and edge models.
ITD and ILD ‘trading’ has typically been investigated using signals that are similar in the left and right ears. Under the edge model, trading is also expected when listening to binaurally independent signals, when broad distributions of cues over time may prompt listeners to report hearing two distinct images or two distinct edges of a single image. Consistent with this model, both the left and right edges of images are heard to shift as ILD is varied.
To coordinate ILD-evoked and ITD-evoked activities into a common pool of activities, modeled neurons responsive to ILD should have frequency-specific ‘labels’ that are congruent with the ‘labels’ of neurons responsive to ITD.
One possibility is a linear relationship between the ‘labels’ of neurons responsive to ILD and IPD.
In the lefthand figure below, for instance, ILD-evoked activities ‘labeled’ with ILDs ranging from -24 to 24 dB are summed with IPD-evoked activities ‘labeled’ with IPDs ranging from -0.2 to 0.2 cycles. The righthand figure shows the same relationship except that IPD ‘labels’ are converted to frequency-specific ITD ‘labels’ (ITD = IPD * frequency).
Another possibility is a ‘proportional’ or ‘scaled’ relationship between ILD and ITD, where the ‘labels’ of neurons responsive to ILD and IPD are both proportionally scaled with frequency.
In the example below, IPD ‘labels’ are transformed into ITD ‘labels’ as:
ITD = IPD / frequency
and ILD (ILDIPD) ‘labels’ are transformed so that peripheral ILD (ILDITD) and ITD ‘labels’ span similar ranges:
ILDITD = ILDIPD / (frequency / (ILDspan / IPDspan)
IPDspan = (|-0.2| + |0.2|) / 2
ILDspan = (|-24| + |24| ) / 2
The relationship between ILD and ITD presents fewer inconsistencies with spatial hearing in comparison to the relationship between ILD and IPD, although combined activities are unit-less. Perhaps the most important reason for favoring ITD is that this allows activities modeled using waveform carrier cues and envelope cues to remain consistent across a broad range of frequencies (note: envelope evoked activities have not yet been added to this website).
Both relationships, nevertheless, have advantages when modeling activities evoked by carrier waveform cues, alone. Some of these similarities and differences are illustrated below using: (1) synthetic signals with recurring ITDs and ILDs across frequency bands, (2) signals spatialized with HRTFs resulting in ITDs and ILDs that vary with frequency or (3) naturalistic sounds resulting in broad fluctuations of ITD and ILD over time.
Fig 1 Modeled activities obtained with a burst of noise ( 0.3 s) spatialized with a recurring ITD of 0.4 ms and ILD of 3 dB across all frequency bands.
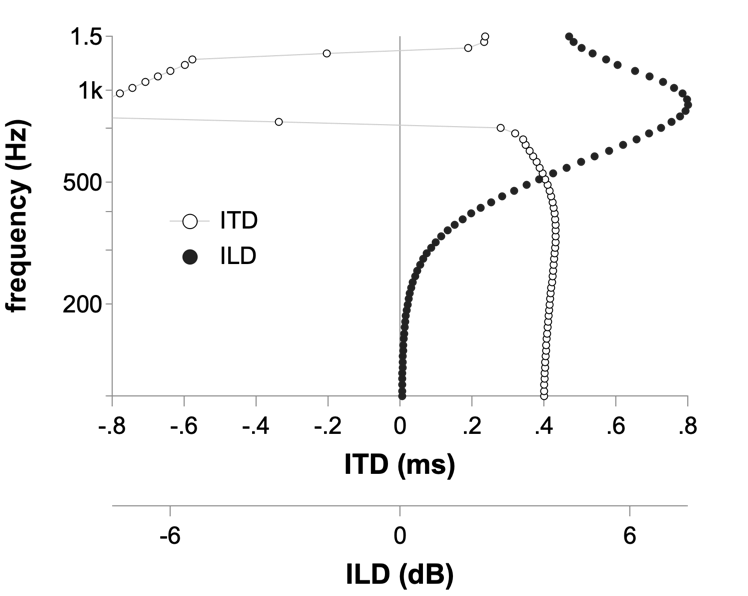
Fig 2 Modeled activities obtained with a burst of noise ( 0.3 s) convolved with an HRTF corresponding to 25° azimuth and 0° elevation, where ITD and ILD to vary with frequency.
Fig 3 Modeled activities obtained with a burst (5 sec) of binaurally independent noise (independence index = 1), during which ITD and ILD fluctuate broadly across frequency bands.
Should the ‘labels’ of neurons responsive to ILD be coordinated with neurons responsive to IPD or ITD?
The ‘labels’ of neurons responsive to ILD appear to coordinate best with ITD, although resulting activities are unit-less and this coordination is unlikely to be linear with frequency.
The most obvious difference, when ILD ‘labels’ are coordinated with IPD, but viewed as a function of ITD, is that combined activities are ‘shifted’ or ‘pulled’ toward the midline as frequency increases. This can be seen in Fig 1 and Fig 2 by pressing the ILD button (3 dB or 25°) and then toggling the top ILD scaled using IPD / ITD button.
One could argue that some amount of coordination between ILD and IPD ‘labels’ makes sense, since ILDs generated by peripheral sound-sources generally increase with frequency. On the other hand, phase-ambiguities at high frequencies can result in unexpected results when coordinating ILD and IPD ‘labels’ (above ~ 500 Hz in Fig 1 and Fig 2).
As mentioned above, the coordination of ILD and ITD ‘labels’ also allows activities modeled using waveform carrier and envelope cues to remain consistent over a broad range of sound frequencies (note: envelope evoked activities have not yet been added to this website).
How does the inclusion of ILD-evoked activities alter ITD-evoked activities?
Activity patterns are seen to be ‘shifted’ or ‘pulled’ when ILD-evoked activities are combined with ITD-evoked activities over time. Thus, ILD-evoked activities in neurons with ‘labels’ that are to the left of those in neurons responsive to ITD act to shift/pull the combined activity pattern to the left. This can be seen in Fig 1, where an ILD of 3 dB shifts/pulls the combined activity pattern to the left.
ITD-evoked activity sub-maxima or ‘edges’ that approach the so-called ‘π-limit’ are also generally shifted/pulled toward the midline and away from the ‘π-limit’. This can be seen in all the above figures but may be the clearest in Fig 3, where activity ‘edges’ at the extreme ends of the ‘π-limit’ are shifted/pulled toward the midline.
Because ILD-evoked activities are not subject to phase wrapping, phase-ambiguous activities evoked by peripheral ITDs may also be diminished. This can be seen for frequency bands above ~400 Hz when comparing ITD-evoked activities alone with activities evoked by both ITDs and ILDs in Fig 1 and Fig 2.

