How spatial cues may be distributed over time in a typical listening situation is a question of interest for a variety of reasons. What persuaded me to begin addressing the question was the need to embed binaural test signals in a background that reflected a typical listening situation. Specifically, I wanted to quantify how frequency-specific magnitudes and phases in the left and right ears should be modified to approximate the types of sounds that might generally precede, follow, supersede, or sum together with sounds of specific interest.
For the analyses below, I used the Sennheiser AMBEO smart headset (black) to record for at least 27.30 seconds, twice a day, for 200 days, resulting in 397 sound files totaling 181 minutes. Recording times were randomized between 8 AM and 10 PM. Distributions of interaural time, phase, and level differences (ITD, IPD, and ILD) were then obtained using zero-crossings after passing each recording through a bank of auditory filters (80 bands, 20-3,000 Hz, log spacing).
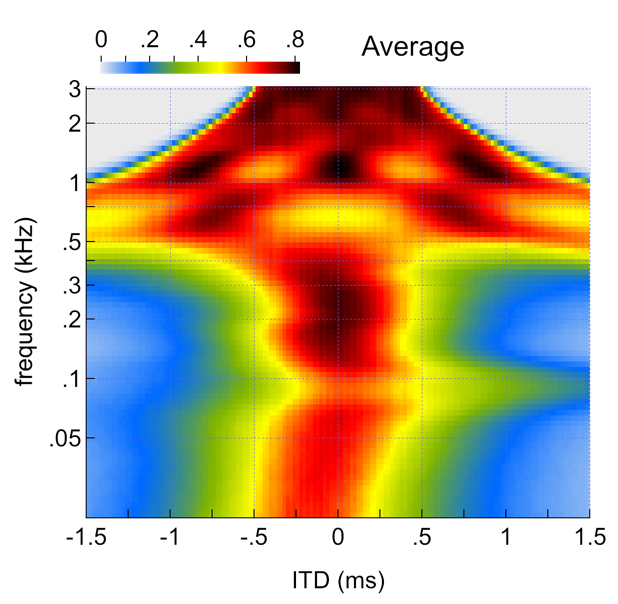
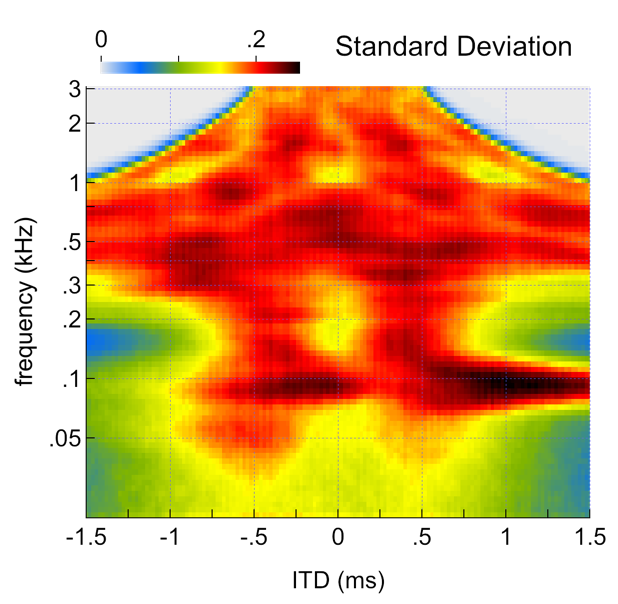
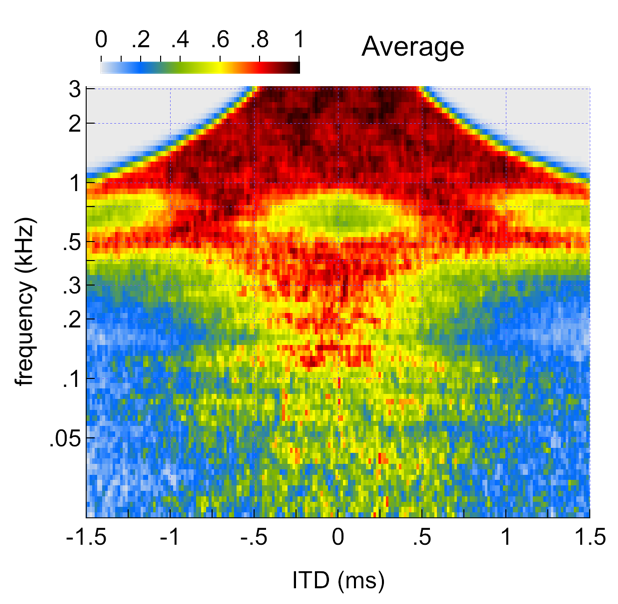
Distributions of interaural time differences (ITD). Average across all recordings (left). Standard deviation across all recordings (middle). Animation showing a random selection of 42 distributions out of 397 (right).
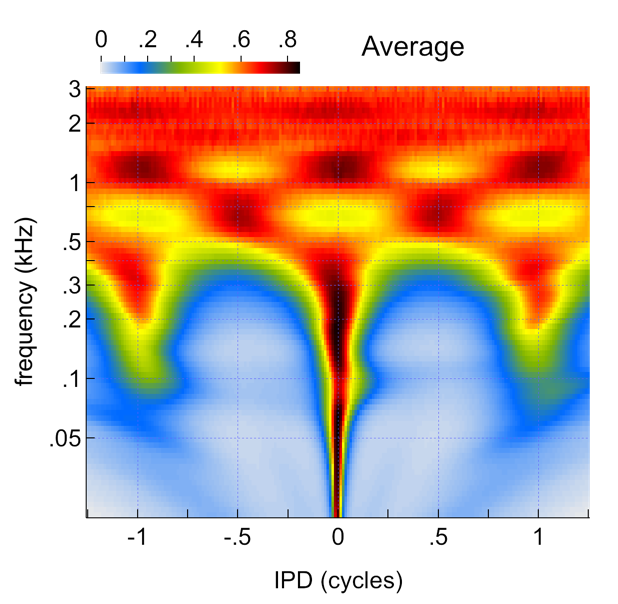
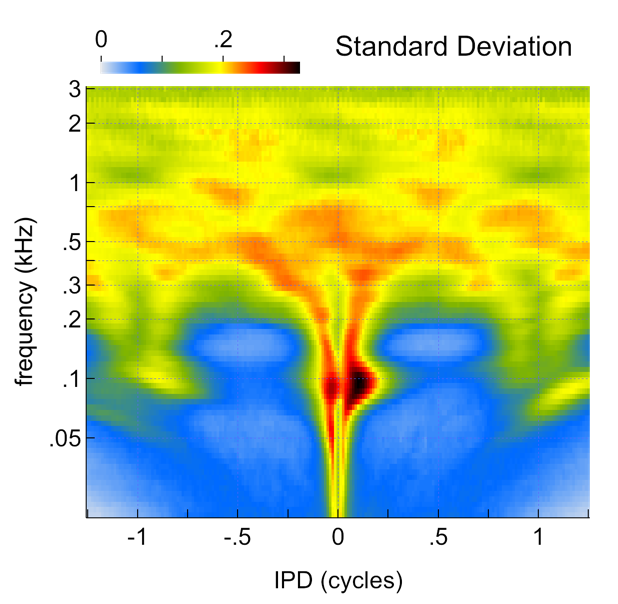
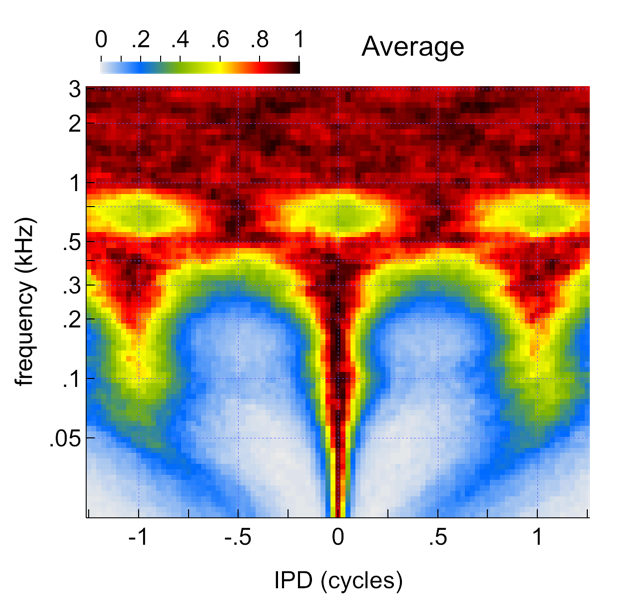
Distributions of interaural phase differences (IPD). Average across all recordings (left). Standard deviation across all recordings (middle). Animation showing a random selection of 42 distributions out of 397 (right).
Distributions of interaural level differences (ILD). Average across all recordings (left). Standard deviation across all recordings (middle). Animation showing a random selection of 42 distributions out of 397 (right).
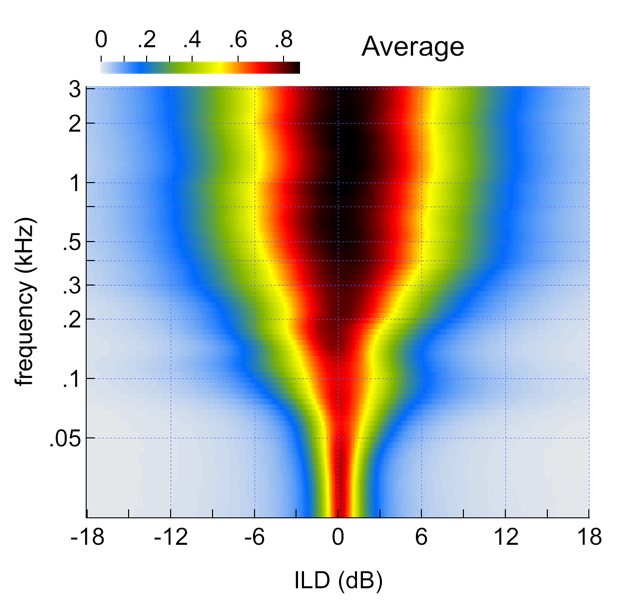
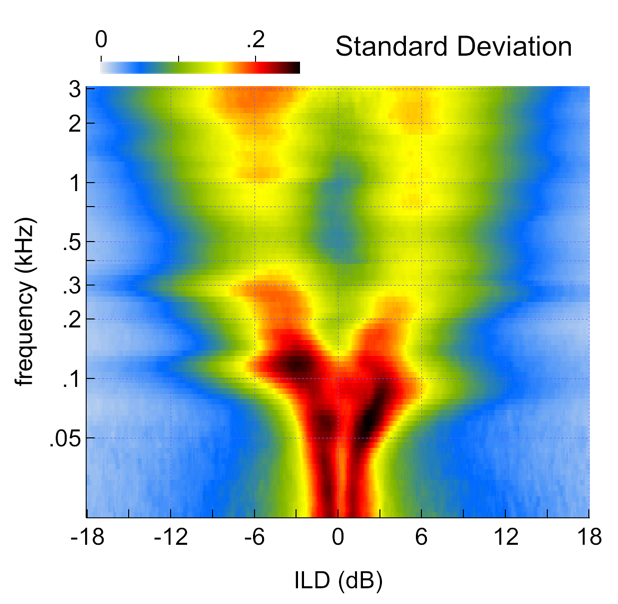
Notes:
● Distributions closely resemble those of an earlier analysis of 350 additional recording obtained using the same methods but with a second Sennheiser AMBEO smart headset (white). Analogous figures for this first dataset can be viewed here.
● Six zero-crossings were obtained per carrier cycle which is why distributions of IPD span more than 1 cycle and why distributions of ITD and IPD may have several distinct ‘peaks.’
● The rightward shift in average IPD and ITD near ~0.1 kHz and increased standard deviation both appear to be characteristics of the location where I often sit and work. The slight leftward shift below ~0.1 kHz also appears to be a characteristic of this location.
● Coming eventually: analyses of fewer but longer recordings obtained with the DPA 4560 CORE Binaural Headset.
● Thinking about: analyses of recordings obtained with the Neumann KU100.
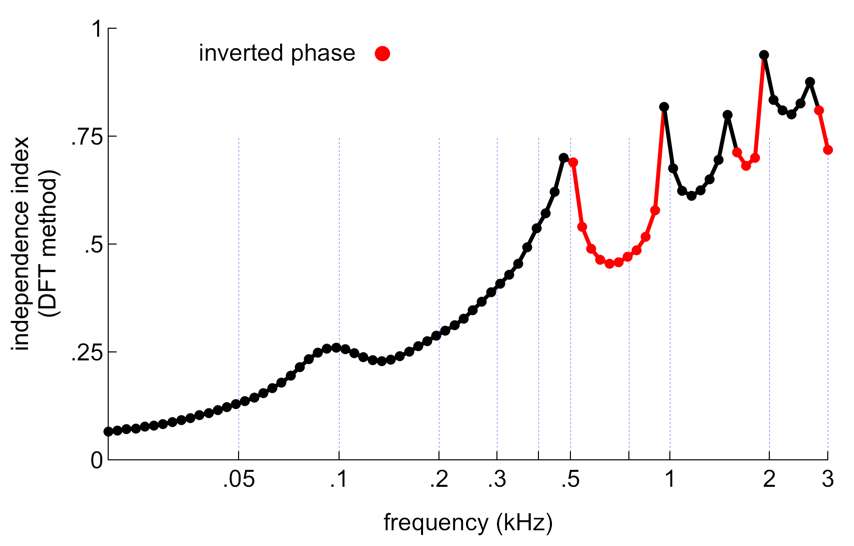
One objective of this exercise was to approximate the types of sounds that might generally precede, follow, supersede, or sum together with sounds of specific interest. Independence indices (DFT method) were therefore derived from the above distributions of IPD and used to generated partially independent binaural noises having roughly similar IPDs and ITDs.
Independence indices (DFT method). In some cases, phase is inverted to obtain the proper IPD distribution (red markers).
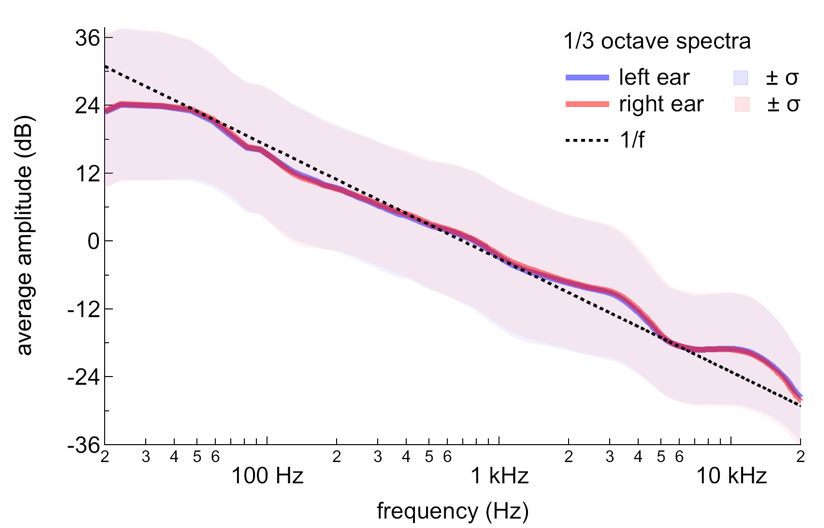
Average spectra across all recordings, with slopes close to
1/frequency.
Distributions of interaural time differences (ITD, left panel) and interaural phase differences (IPD, right panel) obtained across a 10 second burst of binaural noise generated using the above independence indices and indicated phase inversions.
Sound examples. Each noise burst is 1 second with 1/f spectrum.
Partially independent noises shaped with frequency-specific independence indices derived from IPD distributions (see above)
Binaurally independent noises (dichotic), independence index = 1
Binaurally identical noises (diotic), independence index = 0